
Service Desk Performance: Factualize the origin of the IT incident
Today, the performance of a company depends largely on its Information System. This is why the Service Desk is strategic. He must ensure the proper functioning of the network and applications, make good diagnoses but also… anticipate! To carry out this mission, specific expertise and tools are required. Here is our analysis in 2 steps.

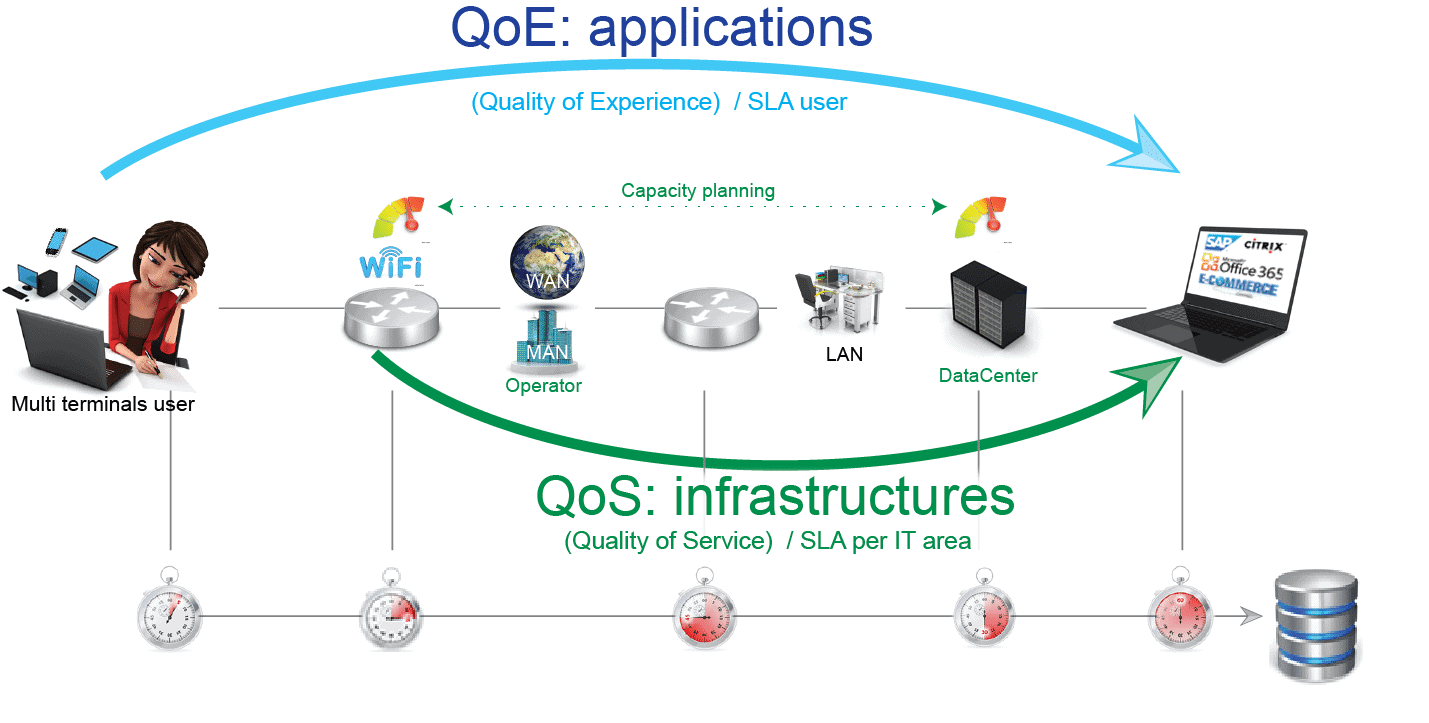
Step 1 / Network analysis: Quality Of Service (QoS) also called Network Performance Management (NPM)
First, the Service Desk measures the performance between the remote site (user site) and the central site (Data Center): is the incident observed at the user site or at the hosting company (Data Center)? If the application is, for example, hosted in New York and the user is in Dublin, where is the congestion? What is the network delay? Is this an acceptable time? Are there any disturbances (packet losses)? Is the anomaly detected between the DC and the user site or vice versa?
The Service Desk will then measure both the load of the Internet link (MPLS) of the remote site and that of the Data Center (bandwidth (incoming/outgoing traffic, interface errors), analysis of the classes of services, etc.). It will also measure the metrics related to the server load (CPU/RAM, services = JVM process) which hosts the application (Data Center).
Is there saturation or a possible configuration problem? These analyses make it possible to size resources (capacity planning) in order to avoid over-sizing (unnecessary costs) or under-sizing (reduced performance). This analysis can be completed using the Netflow protocol, which, through the Top Report, makes it possible to identify more precisely what is saturating the traffic.
If the tests reveal that the problem does not come from the network infrastructure, it can only come from the application layer, which must now be tested in turn.
Step 2 / The application study: Quality Of Experience (QoE) or Application Performance Management (APM)
Evaluating user experience requires the implementation of application descriptors that simulate the user experience. It can be measured through the execution, at regular intervals, of scripts (scenarios) of use of the company’s critical applications. These are played from different locations to identify the hot spot:
- from the remote site (user site)
- from the Cloud
- to the data center.
These business scripts make it possible to identify which page or which element of the application is responsible for a possible slowdown.
These two types of performance analysis are complementary (QoS + QoE) and form the basis of a consolidated vision.
A consolidated vision for your Service Desk
To manage IT performance, whether it be application or network performance, it is necessary to have a continuous and targeted vision of the Information System, as recommended by ITIL best practices.
Having the right information at the right time allows :
- to make the best decisions
- centralize information from a large number of sources
- to have a global control of the traffic at the key points of the architecture (Data Center, Internet access, etc.).
By evaluating the QoS and QoE and by cross-referencing all this data, we can identify the origins of an incident, a slowdown or a malfunction in great detail and remedy it as quickly as possible.
Maltem Insight Performance delivers a precise vision of user experience, application, network and infrastructure performance thanks to a measurement strategy developed in accordance with the realities of your business.